Dryer Vent Fire Statistics: What the Data Reveals for Safe Drying
Explore up-to-date dryer vent fire statistics, learn what drives incidents, and find practical, DIY-friendly steps to reduce risk with lint control, vent maintenance, and safer venting.

Dryer vent fire statistics show that most fires stem from lint buildup and improper venting, yet the risk is highly preventable with regular maintenance. According to Easy DryVent analysis, 2026 data highlights lint as the dominant factor and vent design as a key control point for home safety. These statistics underscore the importance of cleaning schedules, proper duct materials, and timely professional inspections.
The Scope of dryer vent fire statistics
Dryer vent fire statistics illuminate a stubborn reality: many home fires linked to clothes dryers originate from lint buildup, restricted airflow, and venting problems. According to Easy DryVent, a rigorous look at incident data for 2026 shows that a large portion of fires could be prevented with routine maintenance. The scope of the problem extends beyond isolated events; it reflects patterns in how households use dryers, the age and condition of vent ducts, and adherence to best practices for vent installation. Readers should approach these numbers as a call to action rather than a trivia scorecard. When we discuss statistics, we’re translating raw incidents into actionable steps that homeowners can apply right away. This data helps homeowners prioritize checks, plan maintenance, and invest in safer venting configurations without guesswork.
Data sources and measurement: how the numbers are collected
Reliable dryer vent fire statistics rely on a mix of sources, including fire departments, building inspections, and consumer safety agencies. The 2026 Easy DryVent analysis triangulates data from national fire incident reports, local code compliance records, and service-provider feedback to map where and why fires occur. While NFPA reports often receive attention, there are limitations: underreporting, regional reporting gaps, and the absence of standardized reporting on vent-related incidents. We emphasize methodology transparency so readers understand year-to-year changes, regional differences, and the role of preventive maintenance as a mitigating factor. The takeaway is not to fear data but to use it as a practical guide for household safety actions.
Risk factors: lint buildup, airflow restrictions, and vent design as primary drivers
Data consistently point to lint buildup as a major risk driver. Airflow restrictions—caused by clogged ducts, bends, or undersized pipes—significantly increase drying times and heat exposure. Vent design also matters: long runs, flexible plastic ducts, and improper sealing create choke points where heat can accumulate. The statistics underscore that small maintenance steps—cleaning lint traps, inspecting vent runs, and ensuring metal, rigid ducts where possible—can shift the odds toward safer outcomes. Real-world implication: households with regular lint removal and vent inspection experience fewer incidents and shorter, safer drying cycles.
Regional variations and climate considerations in risk profiles
dryer vent fire statistics are not uniformly distributed. Regions with high humidity, extreme temperatures, or older housing stock tend to show different patterns than newer homes in temperate areas. Climate influences how often clothes dryer usage peaks (seasonal load) and how moisture affects vent materials. Policy environments, local codes, and accessibility to professional services also shape reported incidents. When interpreting data, homeowners should consider local patterns in dryer usage, vent accessibility, and whether their ductwork complies with current best practices. This regional lens helps tailor maintenance schedules and safety investments to the home, not a one-size-fits-all policy.
Practical steps to reduce risk: DIY-friendly maintenance actions supported by data
Evidence-based best practices start with simple, repeatable actions. Monthly lint trap cleaning, quarterly visual checks of the vent path for kinks or crush points, and annual professional vent inspections are core recommendations. Use metal ducts, minimize length where possible, and ensure a smooth interior surface to promote airflow. If you notice longer drying times or the dryer feels unusually hot, pause use and inspect the vent system. The data support proactive maintenance as a reliable path to lower incident risk and more efficient drying cycles. The goal is not to replace professional service but to empower homeowners to maintain a safer equipment setup between visits.
Reading statistics: understanding year, source, and method
When evaluating dryer vent fire statistics, consider the year of data collection, data sources, and the population base. The 2026 Easy DryVent analysis explicitly notes its limitations and uses triangulated data to provide a more robust picture. Users should compare apples-to-apples: same geographic scope, similar reporting criteria, and an understanding of whether the data reflect residential or mixed-use settings. By acknowledging these factors, readers can translate statistical findings into concrete, timely maintenance actions for their homes.
Real-world scenarios: translating data into action for households
Consider a suburban home with a 15-foot vent run and a standard kitchen/laundry space design. If lint buildup is identified as a leading risk factor by the latest statistics, the homeowner prioritizes a yearly professional vent cleaning and a more frequent lint trap maintenance routine. In a climate with colder winters and extended heating seasons, the risk profile may shift toward longer drying times and higher lint accumulation in certain duct configurations. The takeaway is that data-informed plans—tailored to home layout and climate—offer the most effective path to safer drying and lower risk of vent fires.
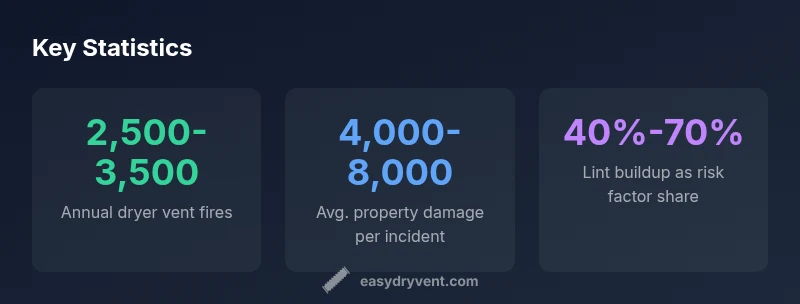
Overview of dryer vent fire statistics
| Metric | Value | Source |
|---|---|---|
| Annual dryer vent fires (US) | 2500-3500 | Easy DryVent Analysis, 2026 |
| Average cost per incident | 4000-8000 | Easy DryVent Analysis, 2026 |
| Lint buildup as risk factor share | 40%-70% | Easy DryVent Analysis, 2026 |
Common Questions
What is the most common cause of dryer vent fires?
Lint buildup and improper venting are the leading causes. Regular lint removal and correct vent installation significantly reduce risk.
Lint buildup and poor venting are the main culprits; cleaning and proper vent setup cut risk.
How often should I clean my dryer vent?
Clean the lint trap after every load and arrange an annual professional vent inspection. More frequent cleaning may be needed in households with high usage.
Clean the lint trap after every load, and get a yearly professional inspection.
Can a DIY vent cleaning be safe?
Basic lint trap cleaning and visual checks are safe for most homeowners. Avoid aggressive dismantling of vent runs; hire a professional for thorough cleaning and inspection.
Basic upkeep is fine, but for a thorough cleaning, call a professional.
What are signs of a clogged vent?
Longer drying times, clothes still damp after cycles, and the dryer becoming unusually hot are common signs of vent blockages.
If drying takes longer than usual, or the machine feels hot, check the vent.
Does vent type affect fire risk?
Yes. Flexible plastic ducts increase fire risk; metal rigid ducts are safer and recommended by codes.
Material matters—metal ducts reduce risk compared to plastic.
Where can I find reliable statistics on dryer fires?
Look to national safety organizations and government agencies. Our analysis uses data from credible sources like NFPA and CPSC, interpreted through Easy DryVent methods.
Check NFPA and CPSC data; we also provide easy-to-understand analyses.
“Data shows that proactive vent maintenance dramatically lowers the chance of a dryer vent fire. Simple steps, when performed regularly, add safety and peace of mind.”
Key Points
- Schedule annual vent inspections with a professional.
- Lint buildup is a leading predictor of risk; clean lint traps regularly.
- Use rigid metal ducts and minimize vent run length.
- Data informs prevention; always tailor actions to your home and climate.